Answer:
At x=-1 is a local maximum.
At x=0.33 is a local minimum.
Step-by-step explanation:
Given : Function 
To find : Use the graph of the function to identify its relative maximum and minimum.
Solution :
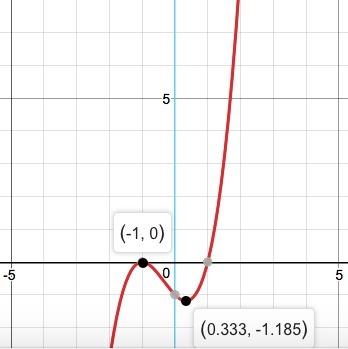
First we plot the graph of the function
Refer the attached figure below.
We know, When the curve is concave down then it gives you maximum and if the curve is concave up then it gives you minimum.
When we examine the graph we get,
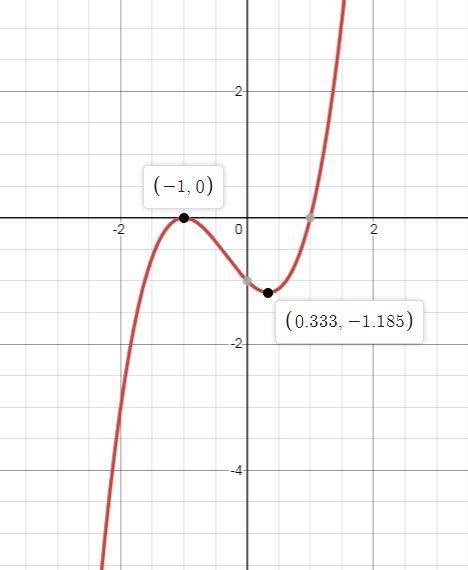
The curve is concave down at point (-1,0) and
The curve is concave up at point (0.33,-1.18).
Therefore,
At x=-1 is a local maximum and
At x=0.33 is a local minimum.