Answer:
24
Step-by-step explanation:
(n+7)2
= (n)(2) + (7)(2)
=2n+14
Answer:
(x,y)(0.4x, 0.4y) is the answer for your question
Answer:
92
Step-by-step explanation:
5 times 18=90
90+2=92
you do times first because order of operations.
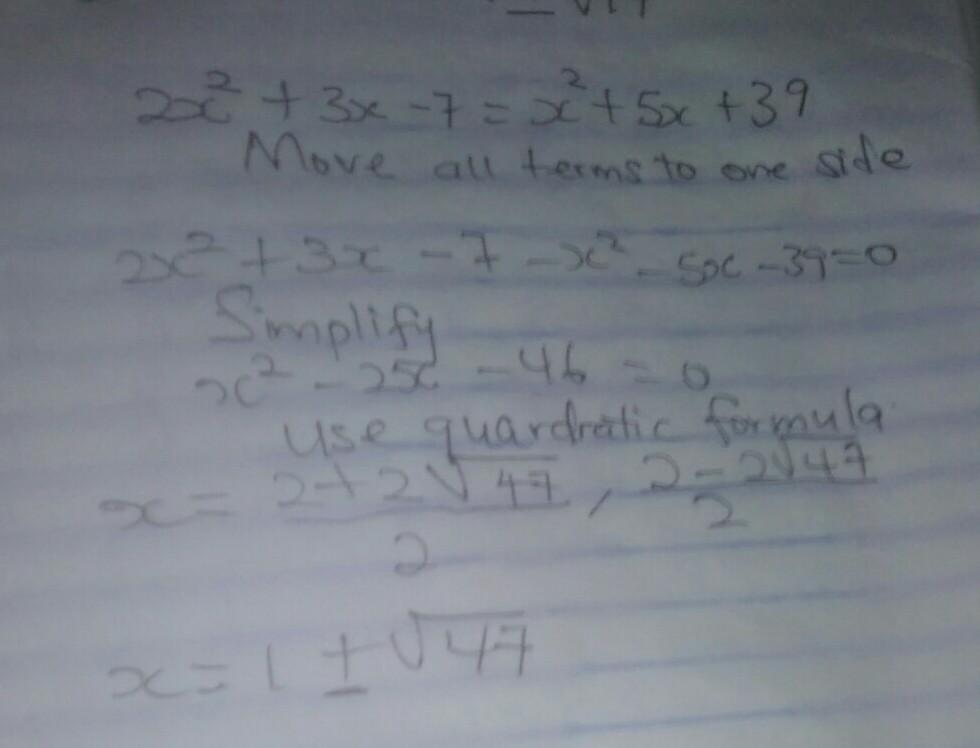
Answer:
x=1±√47
Step-by-step explanation:
it's up above.