Answer:
The correct answer is option D.
Explanation:
The efficient market hypothesis is a theory in modern financial economics which states that the share prices reflect all available information and alpha generation is impossible. Neither fundamental nor technical analysis can give excess returns which are also risk-free.
Share prices in an efficient market reflect all the information, both public and private. This information includes future predictions. All this information is widely available to all the investors and they correctly interpret this information and quickly adjust to it.
Answer:
$8,800
Explanation:
Stock dividend is a type of dividend which is paid in the form of additional shares in the company. It is declared as a ratio or percentage of outstanding shareholding in the company.
Stock Dividend = Numbers of outstanding shares x Stock Dividend percentage
Stock Dividend = 40,000 x 2% = 800 shares
Amount ot be transferred = 800 x $11 = $8,800
Answer:
The expected/required rate of return is 13.8125%.
Explanation:
The stock is a constant growth stock as the dividends are expected to grow constantly forever. The constant dividend growth model of DDM is used to calculate the price of such a stock today. As we already know the price, we will use the formula of the constant growth model to determine the required rate of return. The formula for constant growth model is:
P0 or Price today = D1 / r - g
Plugging in the available known values,
16 = 1.25 / (r - 0.06)
16 * (r - 0.06) = 1.25
16r - 0.96 = 1.25
16r = 1.25 + 0.96
r = 2.21 / 16
r = 0.138125 or 13.8125%
Answer:
$1.90 per share
Explanation:
The computation of the diluted earning per share is shown below:
Diluted earning per share = Net income ÷ Weighted number of outstanding shares
where,
Net income is $680,000
And, the Weighted number of outstanding shares is
= 240,000 + 24,000 × 5
= 240,000 + 120,000
= 360,000 shares
So, the diluted EPS is
= $680,000 ÷ 360,000 shares
= $1.90 per share
We simply applied the above formula
The question is incomplete:
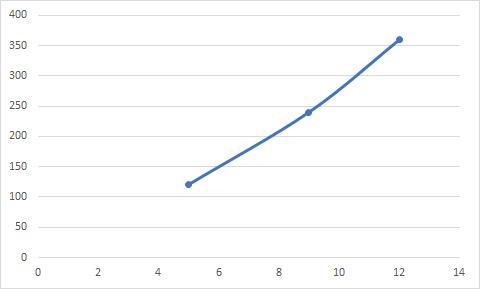
If Farmer Brown plants no seeds on his farm, he gets no harvest. If he plants 1 bag of seeds, he gets 5 bushels of wheat. If he plants 2 bags, he gets 9 bushels. If he plants 3 bags, he gets 12 bushels. A bag of seeds costs $120, and seeds are his only cost.
Farmer Brown's total-cost curve is
a. increasing at an increasing rate.
b. increasing at a decreasing rate.
c. increasing at a constant rate.
d. decreasing.
Answer:
a. increasing at an increasing rate.
Explanation:
To determine the answer, you can create a graph with the information given hich is attached.
You can see that the curve is increasing and because of that you can eliminate option d that is decreasing. Then, you have to consider that increasing at a constant rate would show an straight line which is not the case. Also, increasing at a decreasing rate would show a decreasing slope which is not what you see in the graph. Because of that, the answer is that Farmer Brown’s total cost curve is increasing at an increasing rate because the graphs shows an increasing slope.