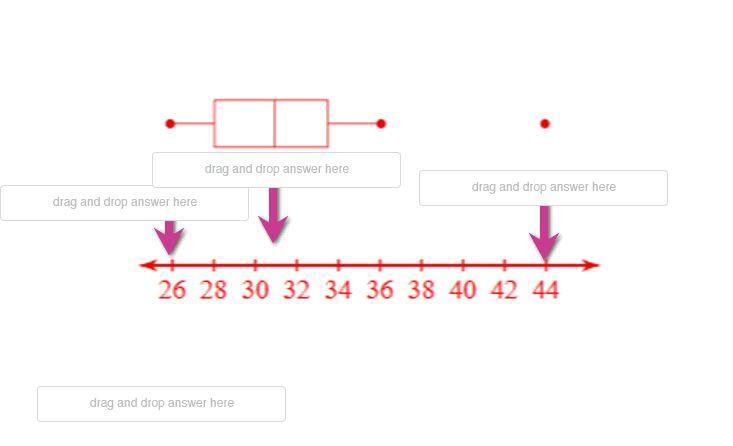
The box and whisker plot displays a set of data obtained from a marketing survey. Drag each item to the appropriate position on
the number line. Drag the extra item to the box not associated with the number line.
Choices...
mean
median
outlier
minimum number in summary of data
picture is where these are suppose to go
1 answer:
Answer:
the one for the arrow point to #26 is min # in summary of data
the one where the arrow points between#30 and 32: median
arrow pointing to #44 is: outlier
and the bottom choice is: mean
Step-by-step explanation:
You might be interested in
Answer: 7
Step-by-step explanation:
jejsjdjjsjd no r tzgxgcyxycufucjvufuemehvy tzgxgcyxycufucjvufue gjf it xuiiii
Answer:
1.11333333
Step-by-step explanation:
I calculated using Symbolab
sorry if its wrong
Answer:
2
Step-by-step explanation:
12.6 divided by pi= 4.01
sqaure root of 4 is 2
Answer:
ghhhhhh
Step-by-step explanation: