Answer:
Option (2). 1
Step-by-step explanation:
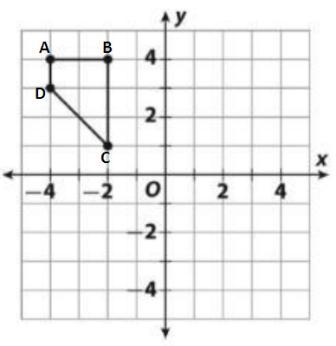
Coordinates of point A, B, C and D are,
A(-4, 4), B(-2, 4), C(-2, 1) and D(-4, 3).
Quadrilateral ABCD when rotated 90° clockwise about the origin,
Rule for the rotation of the vertices,
(x, y) → (y, -x)
Following the rule of rotation coordinates of the image points,
A(-4, 4) → A'(4, 4)
B(-2, 4) → B'(4, 2)
C(-2, 1) → C'(1, 2)
D(-4, 3) → D'(3, 4)
Since all image points have the positive coordinates (x and y coordinates), image quadrilateral A'B'C'D' will be located in 1st quadrant.
Option (2) is the correct option.