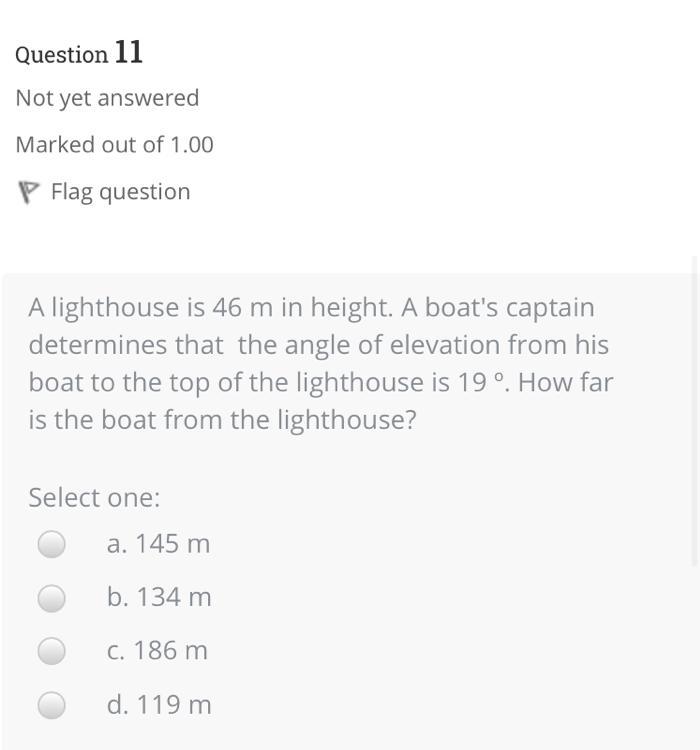
Answer:
√178
Step-by-step explanation:
Distance formula:
Simply plug in your coordinates into the distance formula to find the distance between them.
Answer:
69.66
Step-by-step explanation:
Answer:
Step-by-step explanation:
332 323 233
First problem:
The answer is C because theoretically it should have a 50% of landing
heads but instead it lands heads 56% of the time. Thus this is 6% higher
than 50%. It's not D because there is not specified detail of how the
person got this data so you can assume that the person did a fair
survey/data collection.
Second problem:
So in a data size of 490, 140 of them we trout. This means that 140/490 or 28.57% of the fish are trout. This means that in a sample size of 5000 fish, 5000*0.2857 or 1428.57 are trout.
Third problem:
The Science students seem to have a higher average score because the average score of Math students are:
(32+33+34+34+35+37+39+40+40)/9=36
average score of Science students are:
(41+42+43+43+46+46+47+49+49)/9=45.111
Answer:
The amount of jobs from fitting industry shall decline in 5.5 percent from 2015 to 2025.
Step-by-step explanation:
Due to the assumption of a yearly average rate, a linear function model shall be used. The expected amount of jobs () after a certain amount of years (t) is given by the following formula:
Where:
- Initial amount of jobs in pipe fitting industry, measured in thousands.
- Average yearly rate, measured in thousands per year. (A decline is indicated by a negative sign)
If , and , then:
The percent change in jobs from pipe fitting industry is calculated as follows:
The amount of jobs from fitting industry shall decline in 5.5 percent from 2015 to 2025.