Jeremy rides a Ferris wheel. The graph shows h, Jeremy’s height above the ground at any time during the ride. Which inequality r
epresents the heights shown on the graph? 10 < h < 50 10 ≤ h ≤ 50 h > 10 or h < 50 h ≥ 10 or h ≤ 50
2 answers:
Answer:

Step-by-step explanation:
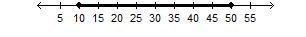
Jeremy rides a Ferris wheel. The graph shows h, Jeremy’s height above the ground at any time during the ride
Number line represents the height above the ground at any time during the ride.
the shaded part of the graph lies between 10 and 50, also we have solid dot at 10 and 50.
So height of the inequality is
Answer:
b. 10 ≤ h ≤ 50
Step-by-step explanation: just took the test
You might be interested in
Answer:

Step-by-step explanation:
We need to find the value of 
Solving:
We know, 


a^0 = 1
so,

So, the value of
Answer:
The answer is 20 and 1/4
Answer:
A
They make the same amount - 20$ per hour
Step-by-step explanation:
200 / 10 = 20 dollars per hour
300 / 15 = 20 dollars per hour
ALSO TOM isn’t an option
HOPE THIS HELPS
PLZZ MARK BRAINLIEST
Answer:
a ≈ 1.8
Step-by-step explanation:
a / sin (180 - 105 - 15)° = 2 /sin 105°
a = (2 /sin 105°) x sin 60°
a = (2 / 0.97) x 0.87
a = 1.79 (≈ 1.8)