Answer:
The investment decreased by 16.5771% per share.
Step-by-step explanation:
Answer:If you would like to know what will the approximate population be after 3 years, you can calculate this using the following steps:
an initial population ... 298 quail
an annual rate ... 8%
an exponential function to model the quail population:
f = 298(1+8%)^t = 298(1+8/100)^t
f ... quail population
t ... time (years)
t = 3 years
f = 298(1+8/100)^t = 298(1.08)^3 = 375.4 quail
375.4 quail after 3 years.
Answer: -6-3x
Step-by-step explanation:
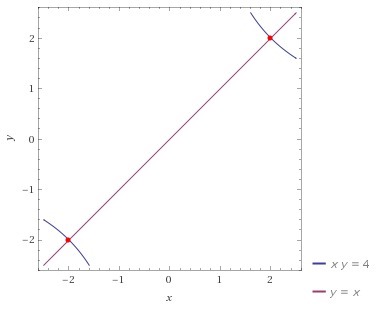
The graph of x and y = 4 is symmetric with respect to the line x = y.
Therefore, the answer is the second option shown above, which is:
<span>
the line y = x</span>
Below is a graph where you can see the symmetry of xy = 4 with respect to the oblique axis x = y. This axis cuts the curves just at its apex