Answer:
A) Find the sketch in attachment.
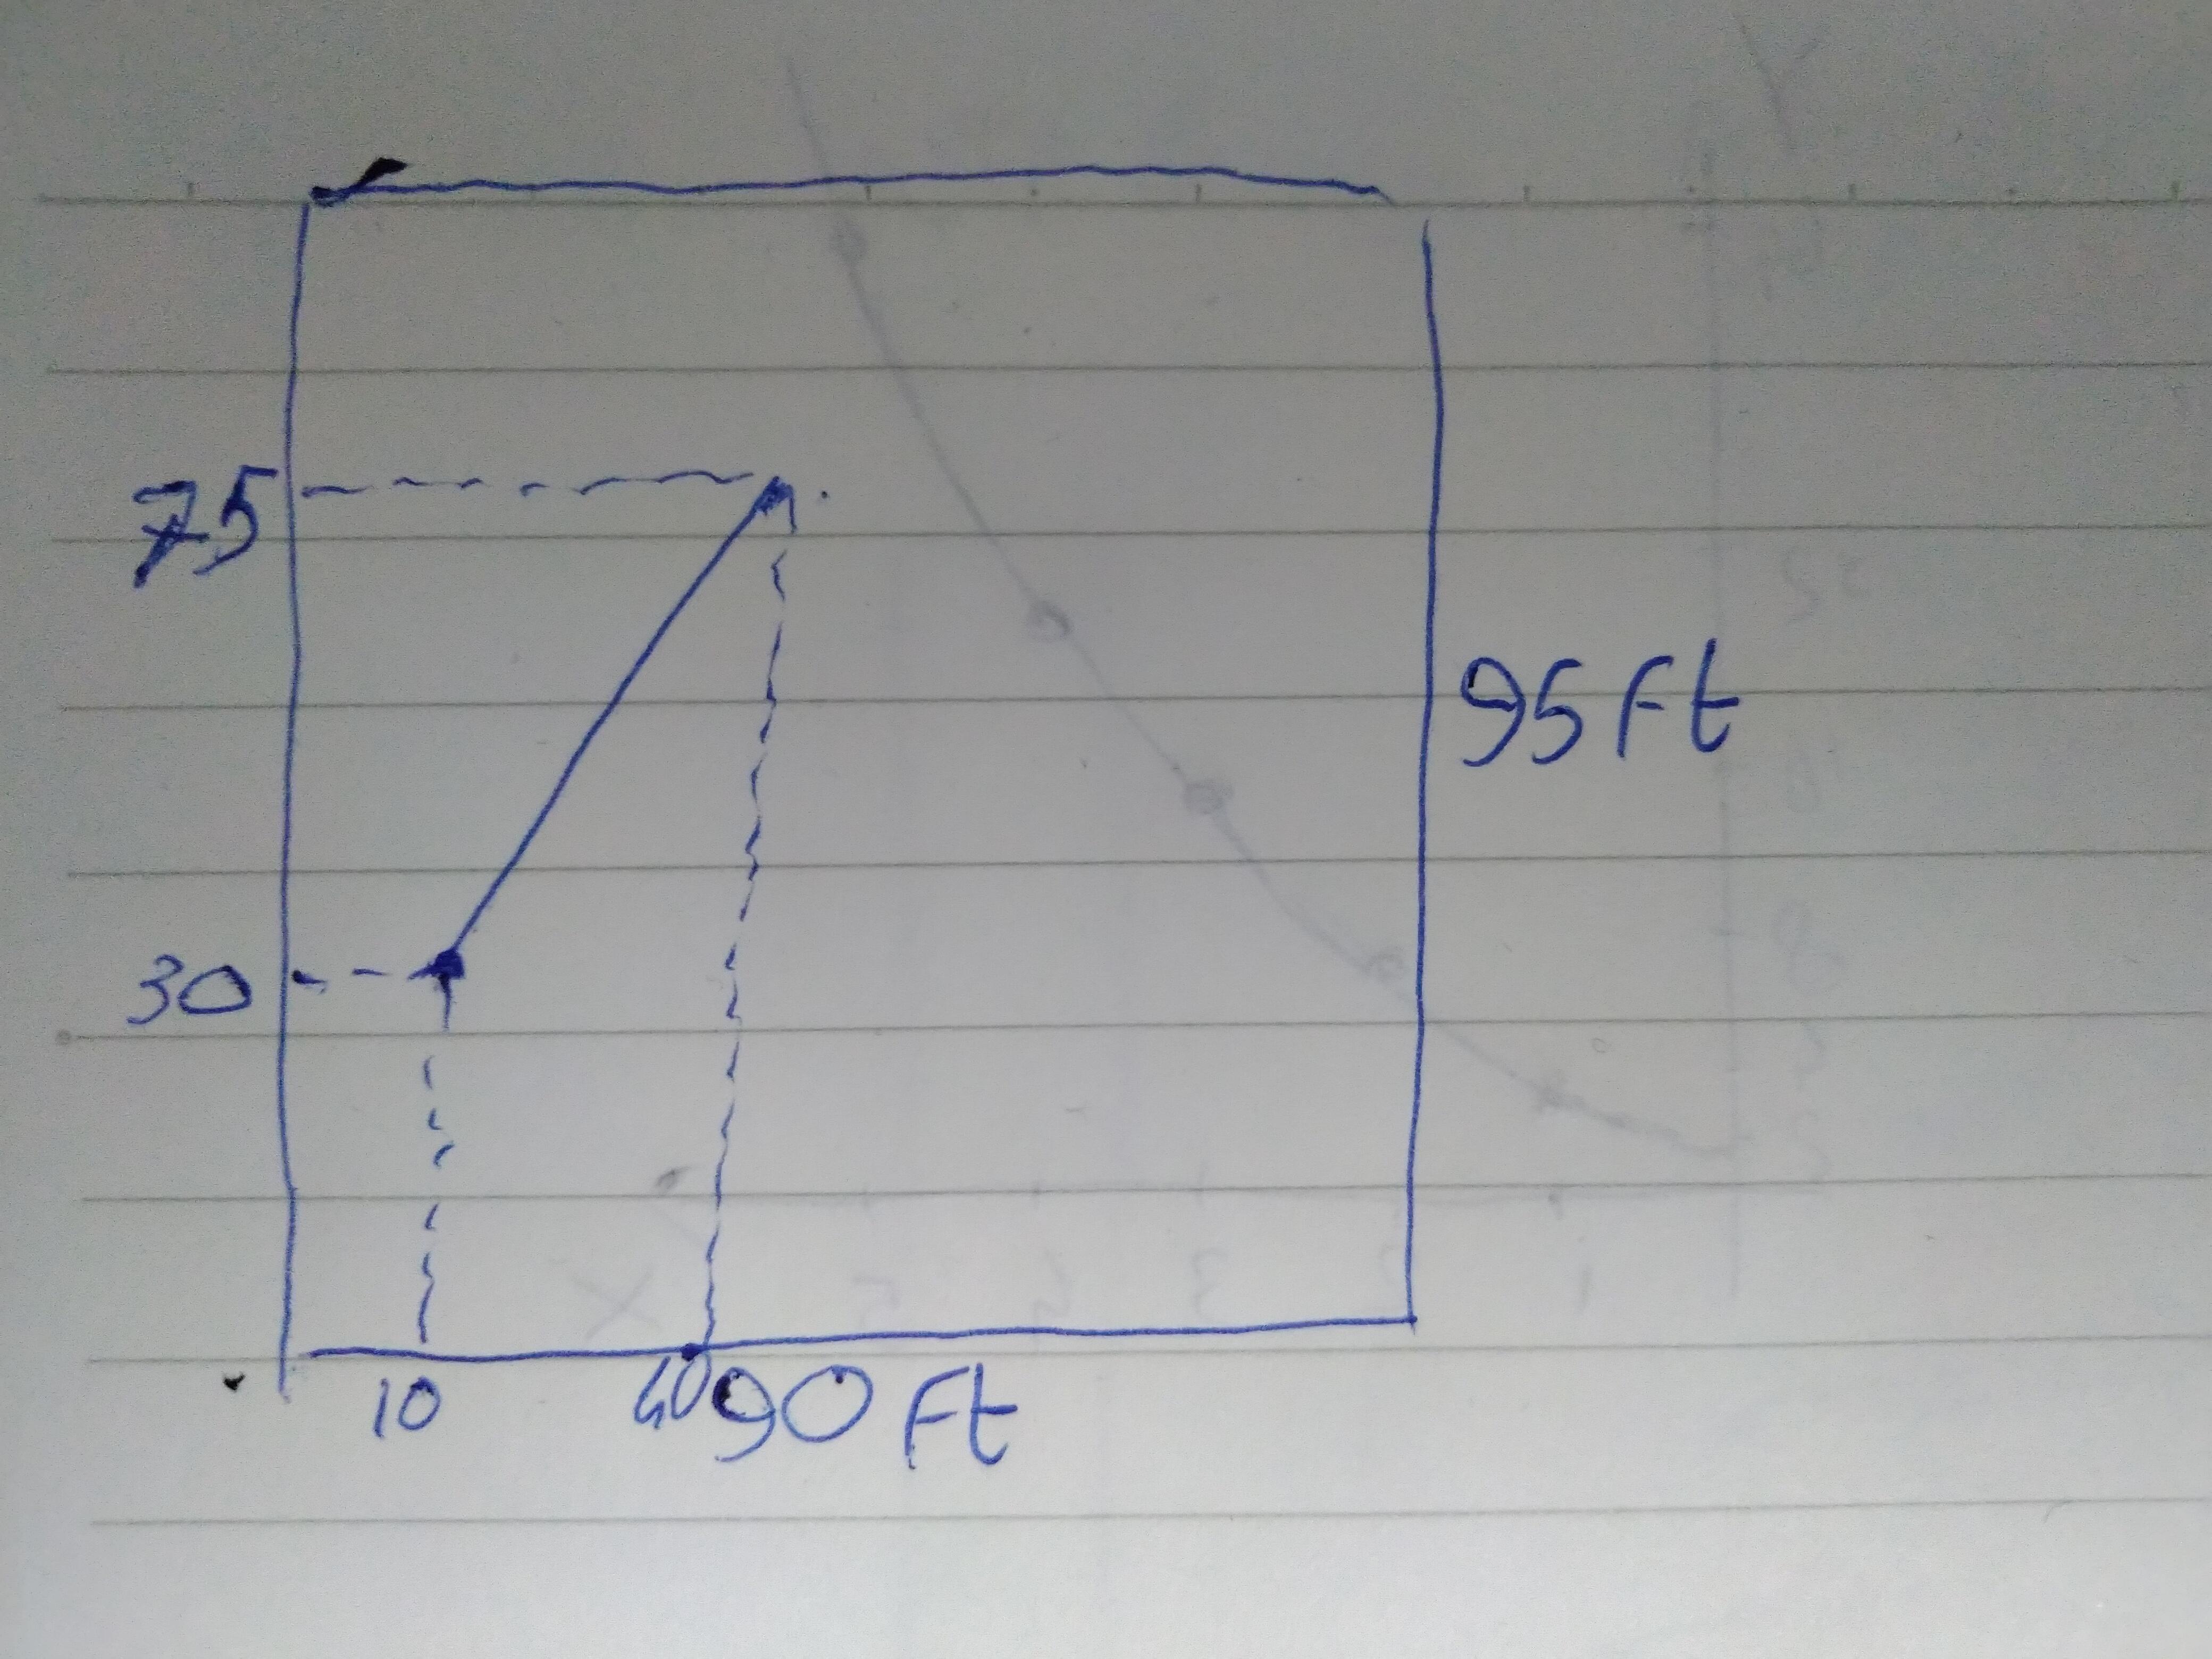
In the sketch, we have plotted:
- The length of the arena on the x-axis (90 feet)
- The width of the arena on the y-axis (95 feet)
- The position of the robot at t = 2 sec (10,30) and its position at t = 8 sec (40,75)
The origin (0,0) is the southweast corner of the arena. The system of inequalities to descibe the region of the arena is:

B)
Since the speed of the robot is constant, it covers equal distances (both in the x- and y- axis) in the same time.
Let's look at the x-axis: the robot has covered 10 ft in 2 s and 40 ft in 8 s. There is a direct proportionality between the two variables, x and t:

So, this means that at t = 0, the value of x is zero as well.
Also, we notice that the value of y increases by  (7.5 feet every second), so the initial value of y at t = 0 is:

So, the initial position of the robot was (0,15) (15 feet above the southwest corner)
C)
The speed of the robot is given by

where d is the distance covered in the time interval t.
The distance covered is the one between the two points (10,30) and (40,75), so it is

While the time elapsed is

Therefore the speed is

D)
The equation for the line of the robot is:

where m is the slope and q is the y-intercept.
The slope of the line is given by:

Which means that we can write an equation for the line as

where q is the y-intercept. Substituting the point (10,30), we find the value of q:

So, the equation of the line is

E)
By prolonging the line above (40,75), we see that the line will hit the north wall. The point at which this happens is the intersection between the lines
and the north wall, which has equation

By equating the two lines, we find:

So the coordinates of impact are (53.3, 95).
F)
The distance covered between the time of impact and the initial moment is the distance between the two points, so:

From part B), we said that the y-coordinate of the robot increases by 15 feet/second.
We also know that the y-position at t = 0 is 15 feet.
This means that the y-position at time t is given by equation:

The time of impact is the time t for which
y = 95 ft
Substituting into the equation and solving for t, we find:

G)
The path followed by the robot is sketched in the second graph.
As the robot hits the north wall (at the point (53.3,95), as calculated previously), then it continues perpendicular to the wall, this means along a direction parallel to the y-axis until it hits the south wall.
As we can see from the sketch, the x-coordinate has not changed (53,3), while the y-coordinate is now zero: so, the robot hits the south wall at the point
(53.3, 0)
H)
The perimeter of the triangle is given by the sum of the length of the three sides.
- The length of 1st side was calculated in part F: 
- The length of the 2nd side is equal to the width of the arena: 
- The length of the 3rd side is the distance between the points (0,15) and (53.3,0):

So the perimeter is

I)
The area of the triangle is given by:

where:
 is the base (the distance between the origin (0,0) and the point (53.3,0)
 is the height (the length of the 2nd side)
Therefore, the area is:

J)
The percentage of balls lying within the area of the triangle traced by the robot is proportional to the fraction of the area of the triangle with respect to the total area of the arena, so it is given by:

where:
 is the area of the triangle
 is the total area of the arena
Therefore substituting, we find: