Answer:
Here I labeled it
Step-by-step explanation:
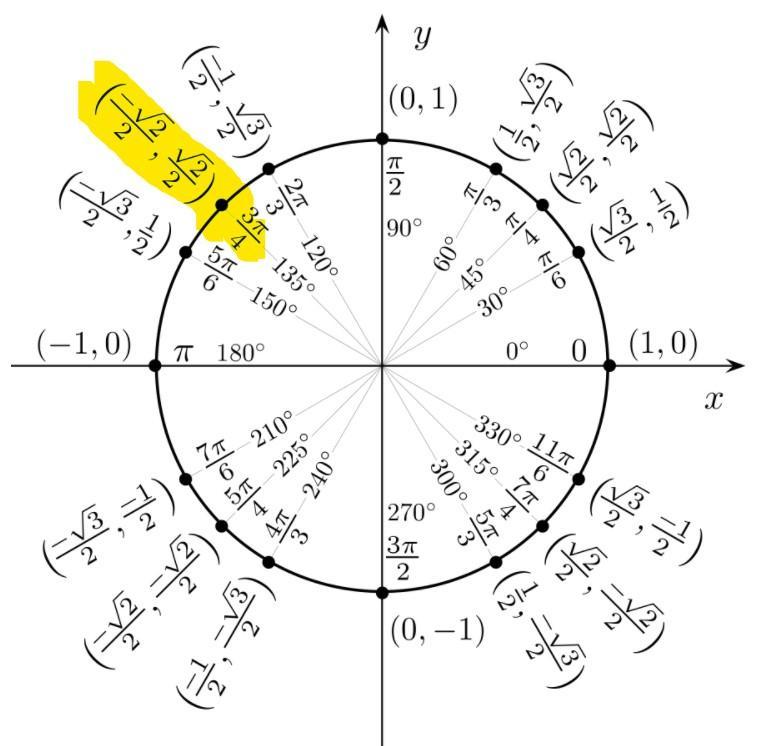
Using the unit circle, the coordinates of 3π/4 is :
![(-\frac{\sqrt[]{2}}{2},\frac{\sqrt[]{2}}{2})](https://tex.z-dn.net/?f=%28-%5Cfrac%7B%5Csqrt%5B%5D%7B2%7D%7D%7B2%7D%2C%5Cfrac%7B%5Csqrt%5B%5D%7B2%7D%7D%7B2%7D%29)
Note that tangent function can be solved using the formula y/x
where x and y are the coordinates of the angle.
This will be :
![\frac{\sqrt[]{2}}{2}\div(-\frac{\sqrt[]{2}}{2})=-1](https://tex.z-dn.net/?f=%5Cfrac%7B%5Csqrt%5B%5D%7B2%7D%7D%7B2%7D%5Cdiv%28-%5Cfrac%7B%5Csqrt%5B%5D%7B2%7D%7D%7B2%7D%29%3D-1)
The answer is -1
Answer:
Freddie would have walked 25 miles after 12 and a half hours.
Step-by-step explanation:
Given that Freddie is walking at a constant speed, and after 2 hours he walked 4 miles, while after 4 hours he walked 8 miles, to determine how long he walked 25 miles, the following calculation must be performed:
4/2 = Miles per hour
2 miles per hour
2X = Y
2X = 25
X = 25/2
X = 12.5
Therefore, Freddie would have walked 25 miles after 12 and a half hours.