Answer: The bottom one is the answer
Step-by-step explanation:
The one on the right wouldn't be correct because histograms are supposed to always be connected from the beginning of it.
The one on the left is ignoring the fact that 40-59 and 60-79 are two different periods of minutes.
So the only correct on would be the bottom one.
1. You already did it.
2. Table
3. t (years since 1990)
4. n (# of cigarettes sold)
5. (t, n)
6. You can see the distribution of the data pretty neatly. There are also many more advantages including it's easier to calculate standard deviation, easier to see the mean, mode and median, and it's also much easier to just tell the extrema of the dataset by just looking at the scattergram.
Answer:
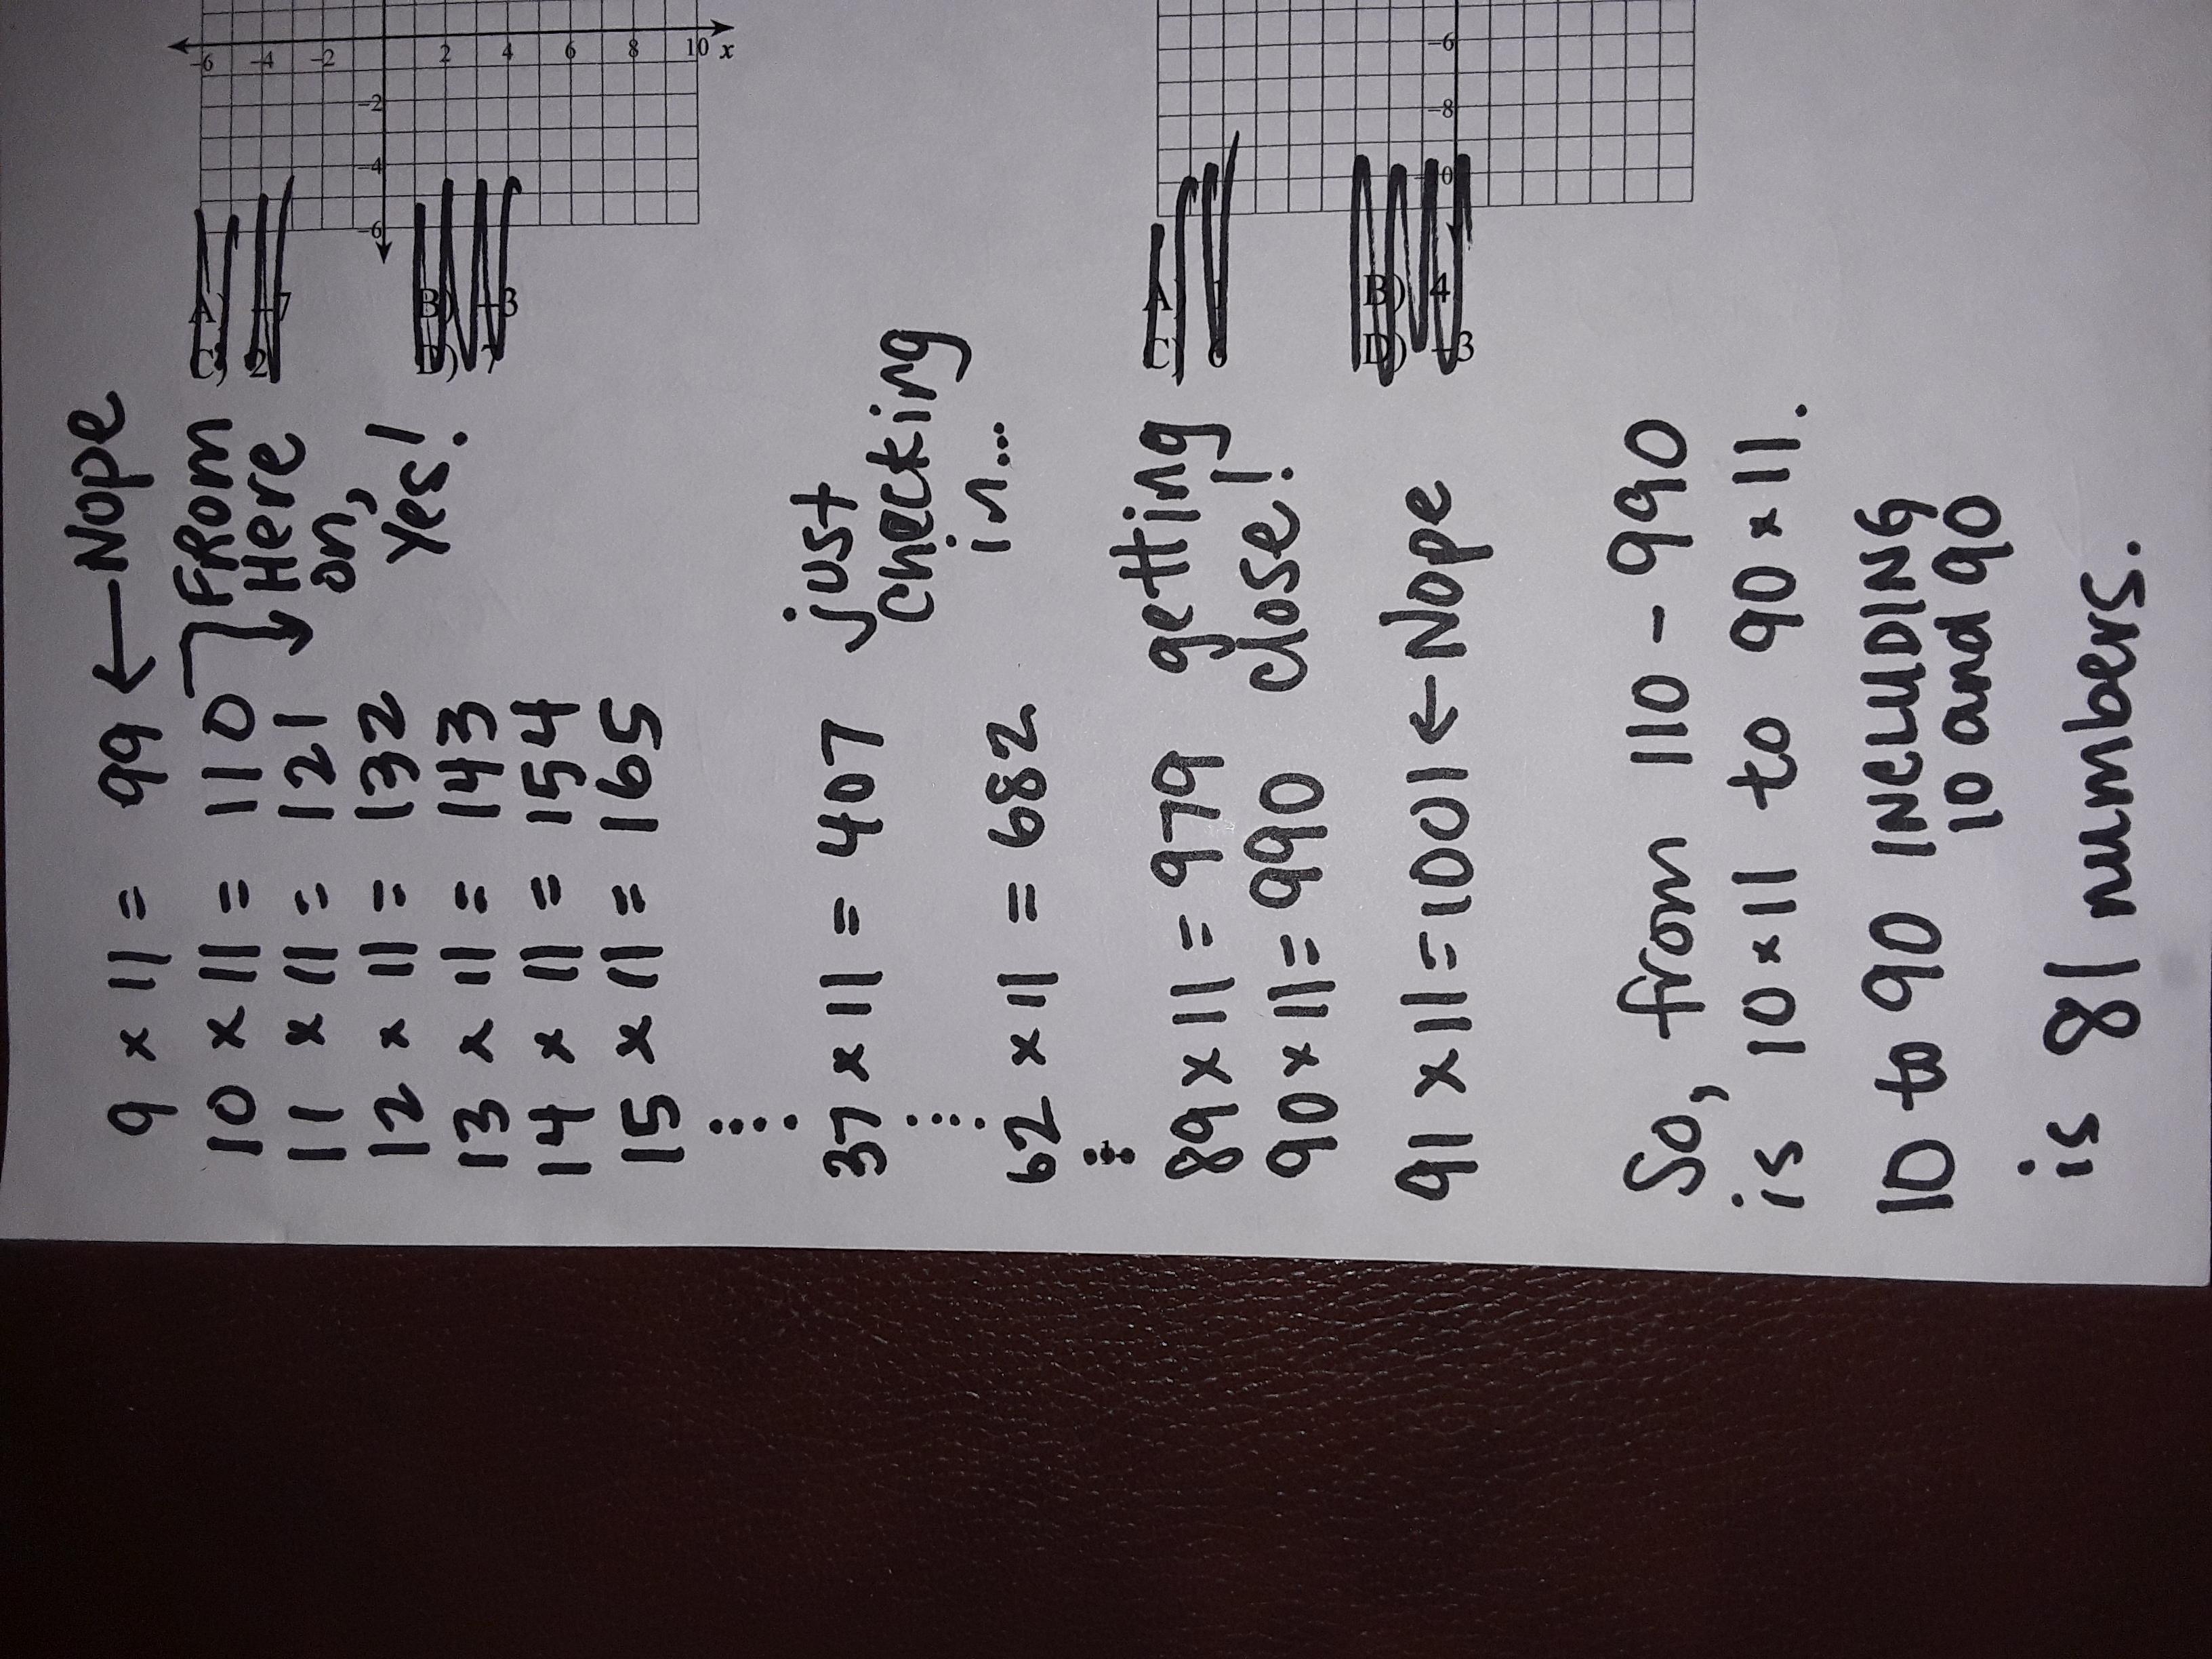
81
Step-by-step explanation:
If a number is divisible by 11, then you can make those numbers by multiplying 11 by any number. Like 33 is divisible by 11 because 3×11 is 33.
Of course, 33 is too small, we are looking for 3-digit numbers...
see image.
Tan x°= Opposite/ adjacent<span>so tan </span>x°=86