Answer:
The correct option is B.
Step-by-step explanation:
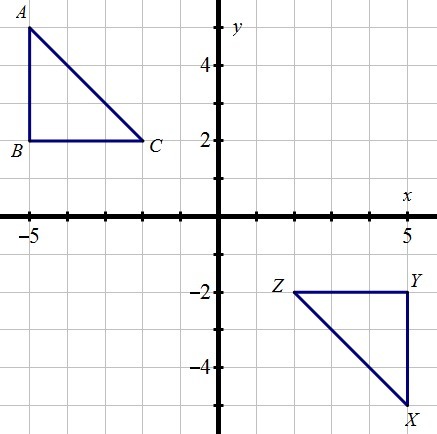
From the given diagram it is clear that the measure of angle B is 90 degrees because it is a right angled triangle.
The coordinates of vertex B are (-5,2).
If a point P(x,y) is rotate 180 degree about the origin, then

The coordinates of image of B are

The coordinates of image of B are (5,-2). These are the coordinates of vertex Y and the measure of angle Y is 90 degree.
The angle Y corresponds to angle B. Therefore the correct option is B.