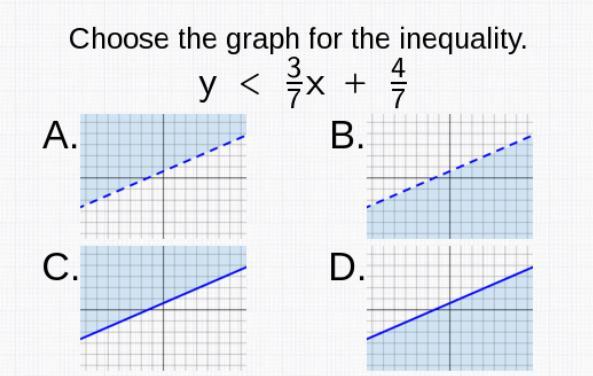
Answer:
B
Step-by-step explanation:
Since the inequality is < then the line separating the shaded and plain regions will be broken.
Thus graph A or B
Choose a test point in each shaded region and check validity of solution
From A choose (0, 2), then
2 < 0 +  → 2 < ← False
From B choose (0, - 2), then
- 2 < 0 + → - 2 < ← True
Thus the graph representing the inequality is B