Answer:
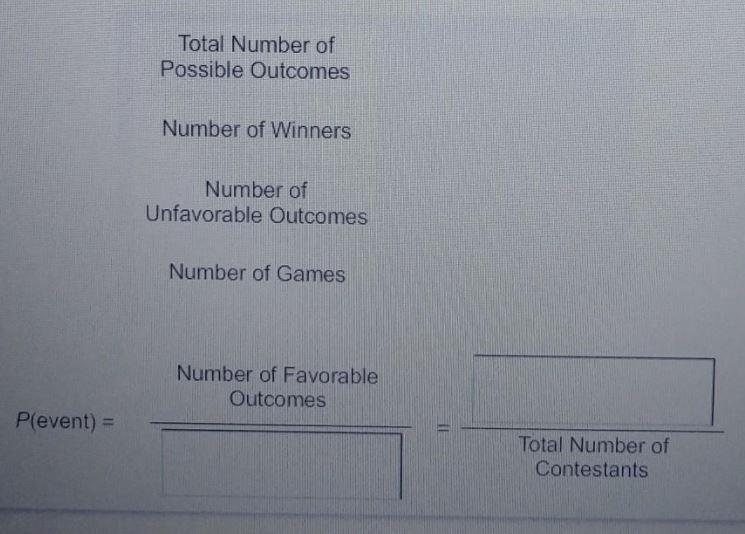
First blank - A)Total Number of Possible Outcomes
Second blank - B)Number of Winners
Step-by-step explanation:
The exact question is as follows :
We know that,
Probability of an event is equals to Total number of Favorable outcomes divided by Total number of outcomes
So,
P(event) = Number of favorable outcomes ÷ Total Number of Possible Outcomes
As we have to predict the Number of winners of a game
So,
P(Number of winner) = Number of winners ÷ Total number of Contestants
∴ we get
P(event) = Number of favorable outcomes ÷ Total Number of Possible Outcomes
= Number of winners ÷ Total number of Contestants
Answer:
1 and 3/7 i think
Step-by-step explanation:
Answer:
-4, -2, -1, 1
Step-by-step explanation:
If the domain is given we use the equation to determine the range but usually the range would be everything in this equation.
(x + 5) * (x − 5) =
x² - 25
----------------
x * x = x² and 5 * (-5) = -25
Answer:
$7
because theres 4 quarters in a mile so one mile would equal to $2 bc
0.50 x 4 = $2
and you have to go 2 miles so
$2 + $2 = $4
then you add the the cost of the taxi so
$4+ $3
= $7