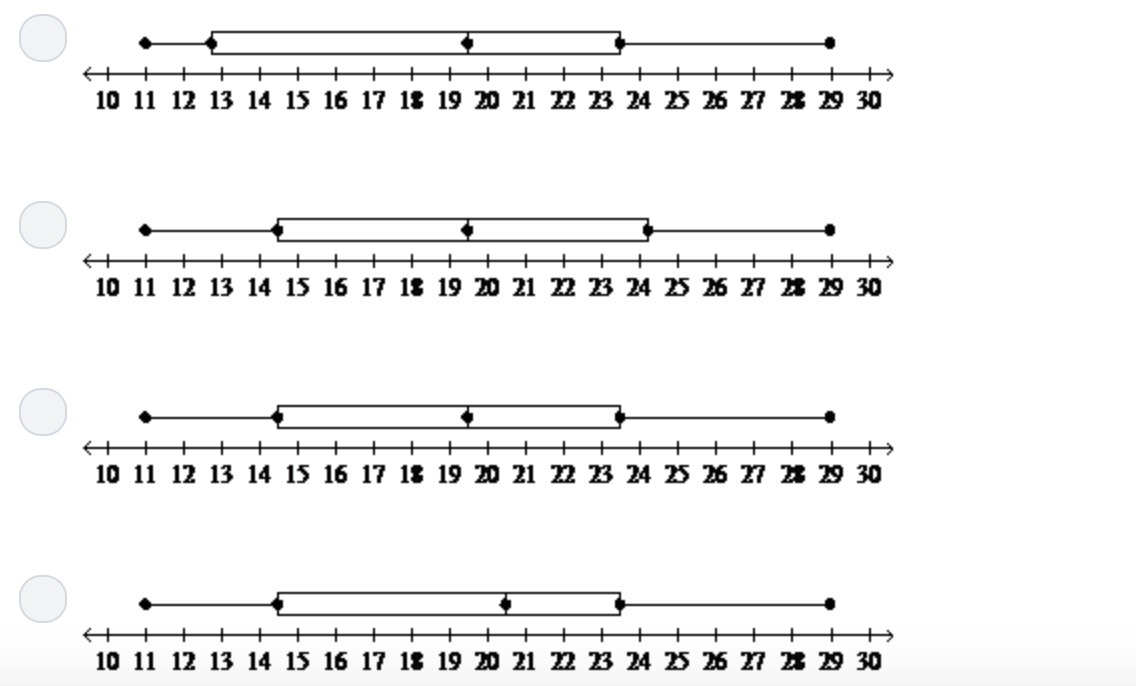
Make a box and whisker plot of the data.
24, 18, 29, 21, 16, 23, 13, 11
2 answers:
To make a box and whisker plot you must first order the data:
11, 13, 16, 18, 21, 23, 24, 29
Then find the median:
19.5
Then split the data into two sections by the median:
11, 13, 16, 18 and 21, 23, 24, 29
Now find the medians of those sets
14.5 and 23.5
With this information we can conclude Option C is the correct plot
Hope this helps!
None of those are correct.
minimum-11
lower quartile-17
median-23.5
upper quartile-26.5
maximum-29
You might be interested in
Answer:
It's just c
Step-by-step explanation:
That's what corresponding angles look like? I don't really know how to explain this. Sorry!
Answer:
X=4
Step-by-step explanation:
28+8=36
36/9=4
9*4=36
36-8=28
x=4
Answer:
th answer i think is thirty
Step-by-step explanation:
30 + 10 = 40 and it said at most $50
tell me if i'm wrong
Answer:
8 fluid ounces
Step-by-step explanation:
I just got it right on my quiz.
Answer:
y-10=9(x+8) in standard form is 9x −y =−82