Answer:
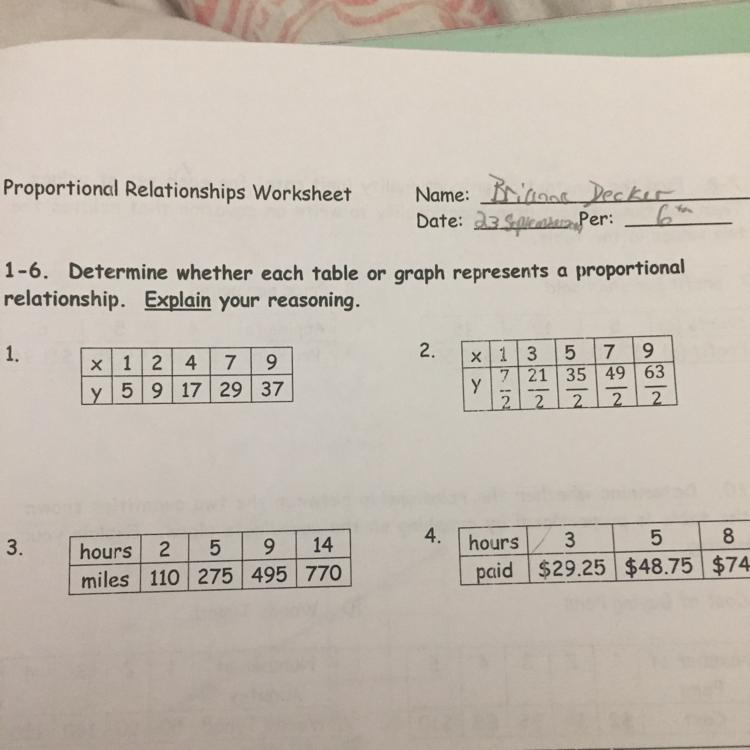
Table 2 and 3 represent a proportional relationship because the ratio between two variables are equivalent.
Step-by-step explanation:
If variable y is proportional to variable x, then


where k is constant of proportionality.
For table 1,


Therefore, table 1 does not represents a proportional relationship.
Similarly
For table 2,

All ratios are equivalent, therefore Table 2 represents a proportional relationship.
For table 3,

All ratios are equivalent, therefore Table 3 represents a proportional relationship.
For table 4,

All ratios are not equivalent, therefore Table 4 does not represent a proportional relationship.