Answer:
No-Solution
Step-by-step explanation:
On a graph the lines do not meet; they are parallel lines
Answer:
Step-by-step explanation:
The formula for determining confidence interval is expressed as
Confidence interval
= mean ± z × s/ √n
Where
z is the value of the z score
s = standard deviation
n = sample size
a) The 95% confidence level has a z value of 1.96
The 99% confidence level has a z value of 2.58
Since 99% confidence level z value is greater than 95% confidence level z value, if we input it into the formula, it will result to a higher confidence interval. So changing from a 95% confidence level to a 99% confidence level would make a confidence interval wider.
b) The √15 is smaller than the √350. This means that if we make use of the formula, √350 will give a lower confidence interval than that of √15. Therefore, the confidence interval would be narrower changing from a sample size of 15 to a sample size of 350.
c) Applying the formula, a standard deviation of 15 pounds would result to a lower confidence interval than a standard deviation of 20 pounds. Therefore, the confidence interval would be wider changing from a standard deviation of 15 pounds to a standard deviation of 20 pounds.
Y measure is 43
X measure is 137
Z measure is 137
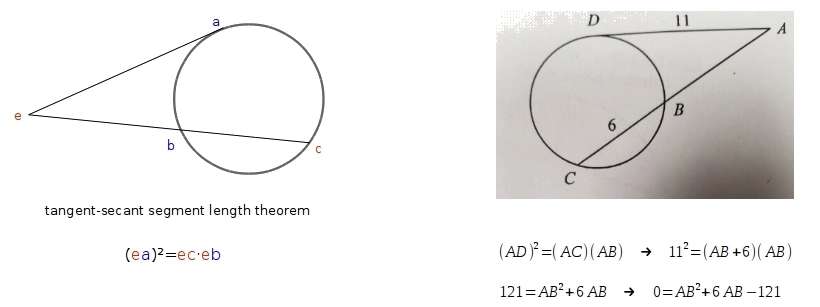
Check the picture below.

since the distance AB cannot be a negative value, thus is not -3-√(130).
Answer:
B. 36
Step-by-step explanation: